The company bottled 250+ SKUs across five different manufacturing plants. As demand spiked, plants were struggling to fill orders on time in part due to frequent product changeovers. The team recognized the need to prioritize but didn’t have a clear view of each SKU’s profitability other than by traditionally derived standard costs. Standard labor and overhead rates hid the cost of complexity (extra steps, additional changeovers, additional storage, etc.) and did not give a true view of profitability, thus making it difficult to make portfolio optimization decisions. Further complicating the situation, each plant had different operating efficiencies and labor costs resulting in different production costs for the same SKU.
Historically, the product portfolio had been managed based primarily on relative sales volume of a SKU. This approach fell short as it did not account for pricing, manufacturing difficulty, and other sources of complexity.
Leveraging similar past experiences, WP&C executed a five-week assessment of the product portfolio. The company’s products were assessed at a channel, category, and SKU level. Once the assessment was complete, opportunities were identified and solutions were developed. Key activities included:
- Applying WP&C's unique Square Root Costing methodology to quickly and accurately identify where profitability is realized at a product and customer level
- Assessing SKU profitability, seasonality, and order patterns
- Identifying a list of no-regret target SKUs for immediate action
- Developing strategies for minimum order quantities, pricing improvements, SKU substitutability, and rationalization
- Creating “rules of thumb” for assessing future SKU decisions and prevent complexity from creeping back into the portfolio
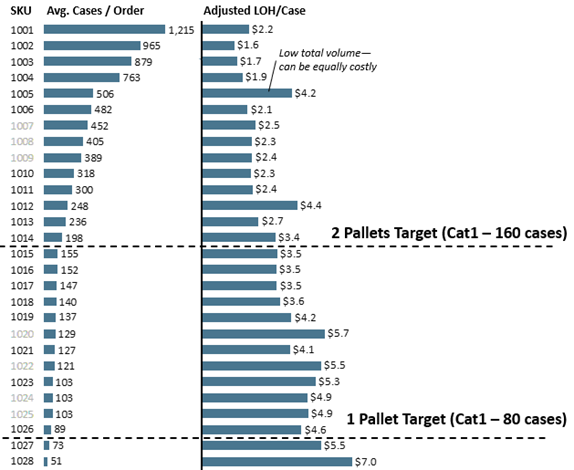
Figure 1: Complexity Adjusted Labor & Overhead Per Case By SKU, Product Category 1
Complexity adjusted labor & overhead per case increases dramatically for orders of less than two full pallets
Throughout the project, WP&C worked closely with finance, sales, and operations teams to identify, qualify, and implement holistic changes. Key recommendations to improve profitability and increase operational efficiency included:
- Price increases of 10-20% on mid-volume SKUs that were currently profit destructive
- Implementation of minimum order quantities of two full pallets per SKU
- Establishment of target to drive minimum annual order quantities of 20K cases per SKU
- Price increases of 5-50% on seasonal and specialty item SKUs
- Substitution of low volume SKUs to higher margin SKUs with similar flavors
- Rationalization of SKUs that can’t implement minimum order quantities, price increase, or substitute
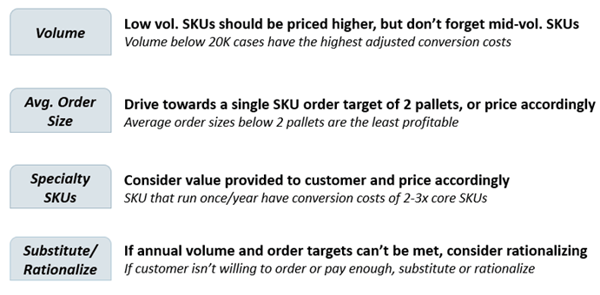
Figure 2: Four “Rules of Thumb” for Managing Complexity
WP&C viewed the business with a complexity lens and developed a new way of understanding profitability at the product level. The WP&C team worked with the company to develop and implement specific solutions at the individual product level to reduce complexity and unlock additional profits. Results included:
- EBIT lift of 13% and 10% in two major product categories
- $1.5M in cost savings due to increased operational efficiency from reduced changeovers and pallet splitting
- 8% reduction of SKUs in one major product category
- A new way of viewing the portfolio to understand true profitability and manage ongoing complexity of the portfolio into the future