Product characteristics dictate the optimal type of production asset to employ, but organizational inertia impeded the plants from adopting more than one type of asset. As a result, products were not necessarily manufactured on the lowest cost asset.
Fleet modernization would help lower costs because each new asset could replace 2–3 legacy machines. However, the limitation of the company's forecasting methods introduced risk. New machines would likely be in service for 10-15 years, but current market forecasts only covered the next 3-5 years. Investing in the wrong type of machine today could evolve into a cost disadvantage that could last years.
Before deploying strategic capital, the company asked WP&C to develop a perspective of the market in 10 years to ensure that they were rebuilding a network that contained the right number and type of machines.
We proposed designing the ideal network using a 10-year “Future Back” approach. Recognizing that the future is uncertain, we began with a market analysis to develop a perspective of future customer needs. Next, we created scenarios of potential futures that any plan would need the flexibility to address. Finally, we projected likely technological advances to define the network composition necessary to meet the needs of each scenario.
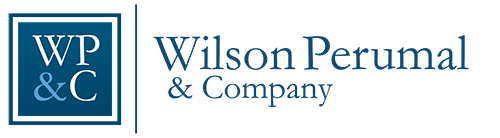
End Market Growth
- Incorporated industry reports, market forecasts, and interviews with primary sources
- Segmented major end markets into subcategories that were growing at different rates
- Factored in macro trends shaping each end market, and quantified the impact on production
- Created a 10-year growth projection
Scenario Analysis
- Created a set of scenarios to define demonstrably divergent future states
- Incorporated potential exogenous shocks along with the base case growth projection
- Assigned probabilities and key indicators that a scenario was unfolding
Technology Evolution
- Researched and interviewed original equipment manufacturers (OEM) to portend technological improvements on speed and performance
- Identified production run length as the primary driver of optimal asset selection
- Segmented the 10-year growth projection by run-length to quantify volume by asset type
- Calculated the required number of assets to meet the demand for each scenario
We traced the asset needs of each scenario back to the present network. This identified “No Regrets” investments that should be made immediately because they would support any scenario. Our 10-year implementation plan would reduce the total number of assets between 50-66%. This holds dramatic implications for future cost reduction by operating fewer machines, and by reducing the number of plants needed to support those machines.
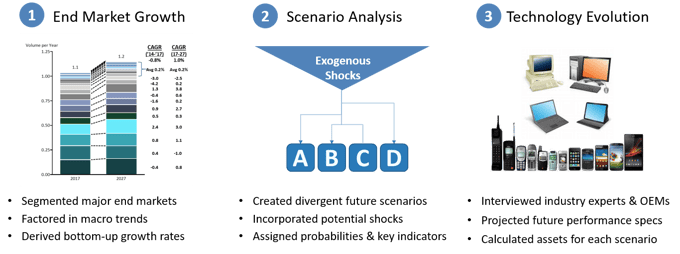
We also identified a large portion of production that was misaligned on suboptimal asset types. We recommended that one of the asset technologies should grow its proportion of production volume from 40% to 60%. This was a substantial departure in thinking and catalyzed an examination on how to align production on optimal assets.
In addition to providing our strategic capital recommendation, we recognized the opportunity to realign production on optimal existing assets for an annual savings of $7-13M. The combination of realigning production and reducing the number of assets creates the opportunity to reduce the number of plants needed in the network. The company asked WP&C to explore the EBITDA impact of network footprint consolidation, which would uncover more than $50M in annual benefits.