Company leadership realized their approach to international expansion and SKU growth was not sustainable and likely hurting profitability. As the company continued to grow internationally, the company introduced products to match a larger array of skin tones and regional trends. Although measures were in place to ensure only major international markets initiated the development of a new product, any market could later include the SKU in their portfolio. The result was ballooning portfolios all over the globe. This ‘one size fits all approach’ to international expansion enabled smaller markets to inflate their portfolio with the belief that offering additional SKUs provided opportunities for increased revenue with no additional costs. However, this approach only considered product development in the cost of bringing a new product to market and failed to take into consideration highly impactful costs such as marketing and inventory management which significantly burden the profitability of a portfolio as variety grows.
Like many of its competitors, the company was looking at product profitability at the gross margin level where every SKU appeared profitable. WP&C challenged leadership to broaden their perspective and consider costs beyond those captured by gross margin. Through plant and distribution center observations, corporate interviews, and extensive data analysis, the team built a comprehensive understanding of cost drivers by product. Leveraging WP&C’s Complexity Costing, the team built a new view of profitability at the SKU level accounting for the true impact of increased product and portfolio complexity. The analysis exposed the cost to manage the company’s highly varied portfolio by revealing inventory, distribution, and marketing costs that were previously not considered and had a dramatic impact on product profitability. Accounting for these costs was the first step in identifying how the company could set a strategy for profitable variety in all markets.
%20v3.jpg?width=600&name=Mary%20Kay%201%20(approach)%20v3.jpg)
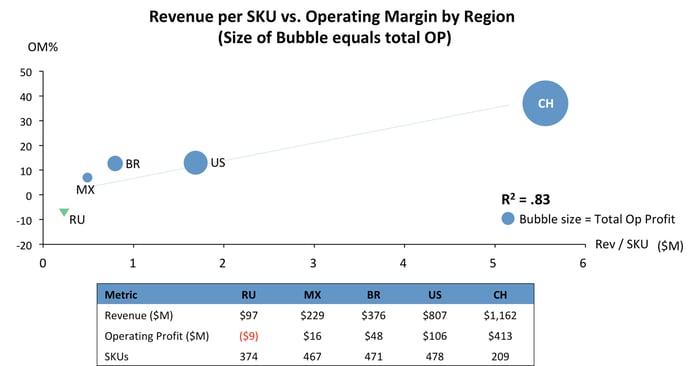
Complexity Costing exposed that larger markets are more profitable, as they commonly sold fewer products, resulting in increased revenue density and scale. Understanding cost drivers and their impact on profitability enabled WP&C to pinpoint which variables predict success for geographic and portfolio expansion. Leveraging these variables which predict success, WP&C conducted a multivariate regression analysis demonstrating that pricing power, market size, and portfolio efficiency significantly drove total profit and operating margin. When average revenue density (revenue per SKU) for a region was higher, markets were able to leverage this scale to grow revenue faster than the growth of complexity. Armed with this information, WP&C continued by building a targeted product-market strategy and country level “playbooks”. The company’s leadership was then able to chart a path forward for opportunities in SKU rationalization, investment, pricing, and service level changes to enable profitable growth.
The client made important advances enabling more profitable portfolio management. Equipped with the explicit financial relationship between each product's and portfolio’s complexity with complexity costs, the company pursued offerings that balanced their true cost with each market’s demand profile, clarifying the profit goals for each market. These actions collectively offered the opportunity to increase profitability by 4–6% ($25–37M).
Once better informed of the hidden financial burden of supporting large portfolios in small markets, the company also embraced a market-centric new product introduction strategy. The company was further able to improve pricing power through a more informed product bundling strategy. The fruits of these efforts offered the company the opportunity to match its market leadership in product development with becoming an industry ROIC leader, a metric where this competitor had been an industry laggard.
Finally, the ‘playbooks’ provide the leadership a foundation to embrace and build upon a sustainable methodology for investing in fewer, more profitable SKUs each season. This more focused use of innovation resources reduced time-to-market, which allowed this competitor to build new market opportunities versus a history of arriving late and the fighting to carve away market share from more agile competitors.