The company was bottling 750+ SKUs in more than 80 different bottle types using six different production lines. A changeover, consisting of either a bottle or liquid change, was required each time a different SKU was bottled, resulting in a significant number of changeovers and thus downtime. Some SKUs were bottled as frequently as every two weeks while others were bottled once a year. Changing batch sizes and frequency also impacted blending, which occurs upstream, as well as inventory holding costs, but just how much was not known. Furthermore, the production plant was not capacity constrained—so more line changes were easy to accommodate.
The company tried various approaches only to find conventional optimization methods fall short of addressing both production and inventory costs. The company was unable to bridge these shortcomings and knew that they needed a better method of scheduling.

Increasing run lengths and changeovers were both under consideration but management was uncertain on how and where to act. However, they knew that they needed a fresh look.
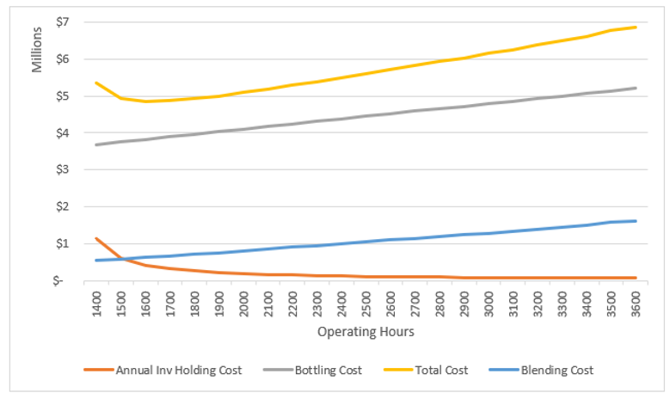
WP&C’s approach, underpinned by its Optimal Batch Size Equation, allowed scheduling to consider multiple factors including demand, setup time, and inventory holding costs for each product. Through this effort, the team was able to determine the optimal batch sizes and frequency of each SKU at a given operating hour. By then incorporating blending, production, and inventory holding costs across a range of operating hours, the optimal operating hour for each production line could be determined and also defended.
After approximately three weeks, deep diving into the company’s bottling operations and financials, WP&C provided the management team with a clear vision of how to optimize production scheduling. Recommendations included:
- Batch Size & Frequency: Optimal batch size and frequency of production for each SKU as well as how often each bottle type should be run
- Target Operating Hours: Operating hours by production line that minimize total operating and inventory holding costs
- Longer Production Planning Window: Lengthening the production planning window to 48 weeks from the legacy 6 weeks to aid in optimal batch sizing implementation
- Batch Sizing Model: A new model that can be updated in-house to assist in planning future production schedules and inventory levels
By utilizing WP&C’s Optimal Batch Size Methodology, the company was able to incorporate cost tradeoffs into strategic scheduling and production. WP&C identified an opportunity to reduce inventory by 30% while also reducing operating hours by 20-30%. The operational savings can be used to bottle additional products or to more efficiently utilize the company’s existing labor force amidst a tight labor market. The company also now has a dynamic model that can be used to guide decision making as operating conditions change.